
 3685
3685
PCMTec Edition Required: Any Editions.
The data logger is built into the PCMTec Editor and allows you to seamlessly log your vehicle, switch between the Navigator and Flashing windows during a logging session, and then continue logging after reflashing and restarting the vehicle. In this guide, we will give you a basic rundown on how to use the Datalogger. If you want to know the Datalogger in detail, please check out the latest Datalogger Manual which can be accessed via "Help -> View Datalogger Manual" or open here.

If you want to skip the following content as it is in the format of text (totally understand!). Please click on "PCMTec Datalogger Overview." or "PCMTec Datalogger 2.11 October 2022 Update." in the "On this page" on the right. We have two videos that will demonstrate to you how to use the Datalogger and what is the latest update in the current website release (2.11.8339).
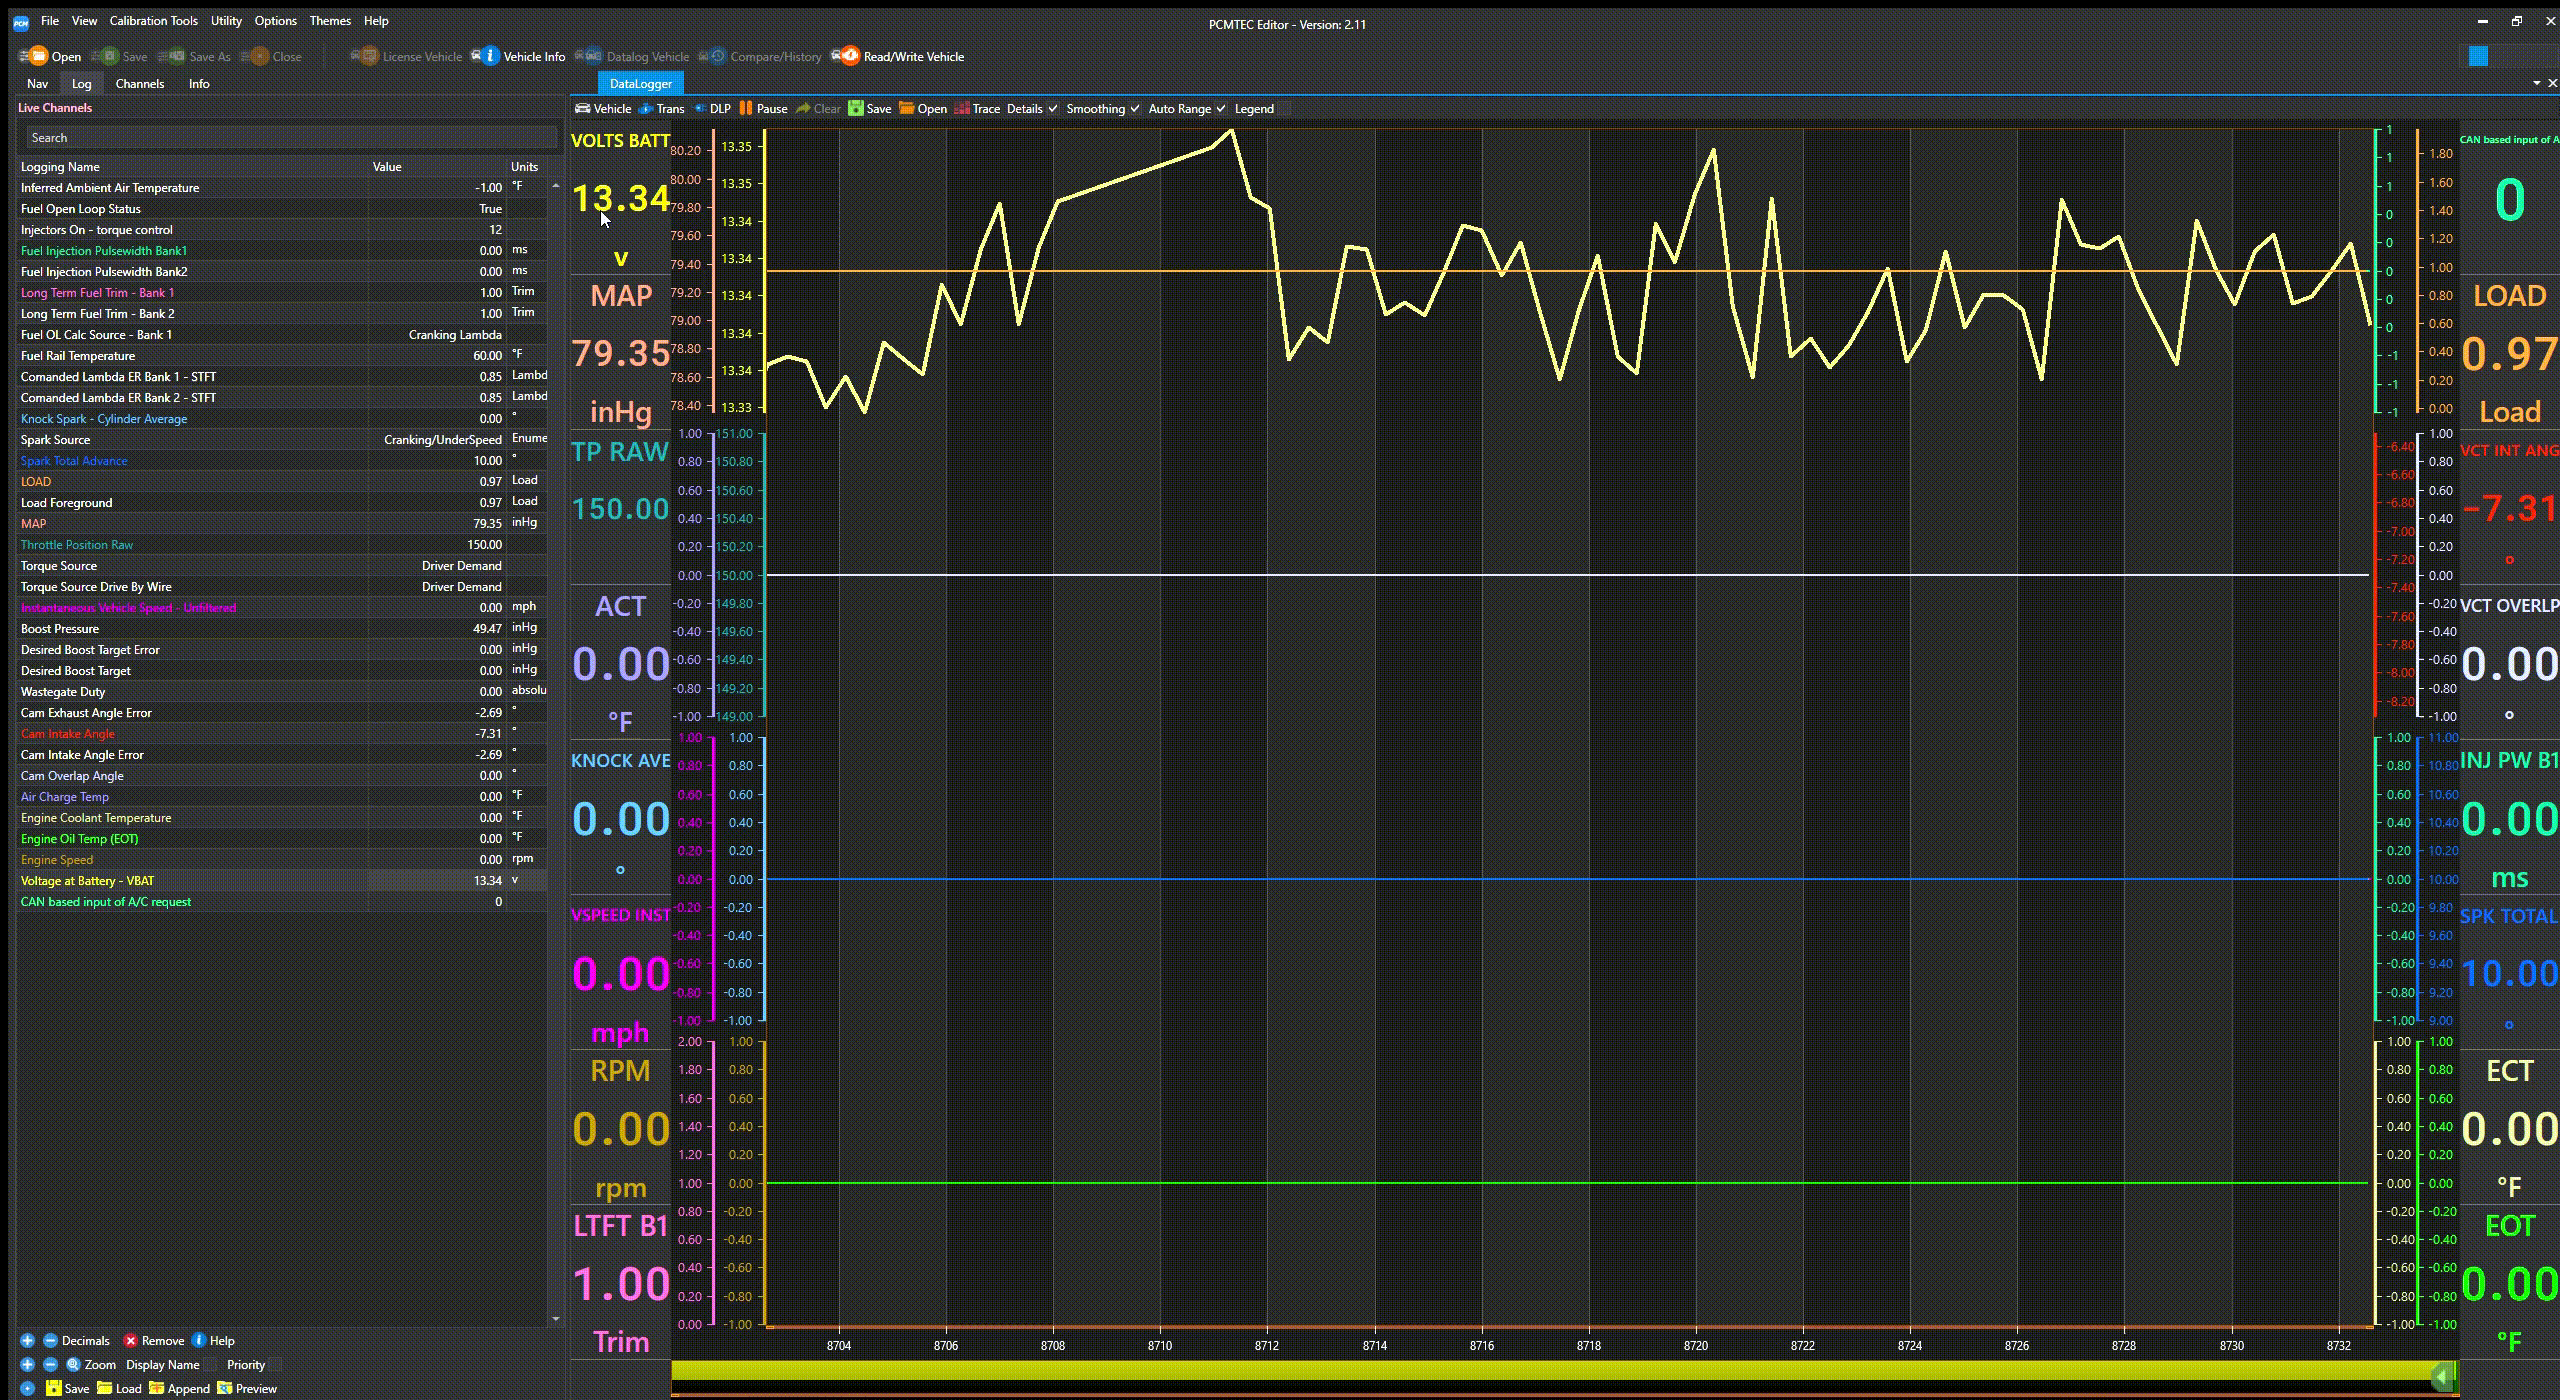
Now, let's get started. Note, all screenshots in this guide use Editor Version 2.11.8339 as examples.
Start Data Logging
Start up the PCMTec Editor and connect the car to the PC using the cable(e.g. Tactrix) via the car's OBD2 port. Then click on "Datalog Vehicle".

Once the Datalogger window is opened, and the vehicle ignition turned on, the Datalogger will automatically connect to the Vehicle PCM.

Vehicles with a ZF automatic transmission can connect also the transmission, using the "Trans" button.
External logging for recording AFRs, boost pressure, or other user-defined variables can be done using the DLP IO8-G Analogue/Digitial converter. This is covered in another HOWTO here.
Select Channels
Use the "Channels" tab to select which scalars you wish to view in the chart. Whilst the chart itself can display up to 16 channels (comprised of 4 charts, with 4 slots per chart), extra channels can be logged and saved, and reviewed later on.
These can be selected live whilst connected to the PCM and TCM (ZF) and are then added to the logging session.

Clicking on the "Log" tab displays the currently selected items. Anything greyed out is not displayed on the chart, but can be added using the right-click menu.

Allocate Chart Items
Right-click and select a chart item to allocate "Voltage at Battery - VBAT" to Chart 4 / Slot 1 for example.
Otherwise use "Multi Chart Add "to quickly add to the next available slot (if any are available).

That now displays in our chart.

Using "Scalar Delete" will remove items from the chart, but they will still be recorded as part of the logging session.
Using "Chart Remove" will free up the slot on the chart, but keep logging it and displayed it in the "Log" section (greyed out).
Adjust Ranges
There are several methods to adjust the ranges of scalars from their defaults:
- Right-click the scalar and adjust the range.

- Click and use the "Zoom +/-" buttons.

- Hover the axis and use the mouse scroll button, and adjust by holding and moving up / down.

-
Otherwise, click the axis and use the "CTRL + PAGE UP / DOWN" keys.
Use the "PAGE UP / PAGE DOWN" keys to adjust the position of the axis.
-
Right-click the axis and adjust the range using the window.

All range adjustments are saved and can be stored in the "Save Layout" feature.
![]()
Sort Scalar Items List

By default, all items are sorted into their parent groups, matching the "Channel“ tree.
To move items, click on the scalar you would like to move, hold down the CTRL button on the keyboard and use the UP or DOWN arrows on the keyboard.
For example, I used CTRL UP and CTRL DOWN to move the scalar items with all temperature scalars positioned together.

If you right-click anywhere in the scalar area and click "Auto sort" it will reset the custom sorting back to default sort by the parent.
Another option is to group by "Parent". This will group items into clear sections by their parent.

Enumerated Items
Some chart items like "Spark Source" have meanings attached to the values, these are enumerated items. You can display the raw value by unticking the "Enumerated" tickbox.
![]()

Update rates
Whilst there are no limitations on the number of channels you can data log, on BA all channels will be "polled". Adding more channels will gradually reduce the update rate. On vehicles BF upwards, rapid packet reading is available for up to at least 15 DMRs, and then polling is available on top of this.
If one of the channels you have selected requires a faster update rate, it can be forced to use the rapid packet by selecting "High Priority" for that channel.

Layout Load / Save
Use the "Save / Load / Append" layout buttons (also available from the File menu) to keep a copy of your current chart configuration, including the items ticked, their chart slot, and their ranges.
![]()
"Append" will add extra chart items to your current chart (ticked and their position if available) if they were not ticked previously. Note: Where a slot is already used, these will be ignored and not displayed.
"Preview" will use the selected layout file temporarily and will not save the layout to the settings.
Layout files are saved in the PCMTec/Logging layouts folder and saved as TLO files.

Pause / Start / Clear Buttons
![]()
![]()
During logging, you can pause the live log updates (logging will still happen in the background) and then review your current log by moving the blue cursor.
You can drag the cursor with the LHS mouse button and move the mouse, or use the LEFT / RIGHT cursor keys. Holding the cursor keys will flip through the log page by page as it scrolls through the log. The legend/scalar values will update showing the current values at the cursor, even during a live logging session.
The "Clear" button will clear out the current log. If the logging is over 10 seconds then you will be prompted if you want to keep the log.

Logs are auto-saved in case you wish to retrieve something later, then check out the auto-save folder.

Loading and Saving Logs
![]()
Use the "Save" icon to save your log as a TECLOG or CSV file (for loading into other software like MegaLogViewer for example).
"Open" the file will start in the PCMTec/Data logs folder, where your saved files are located.

CSV files from PCMTEC as well as other Ford tuning software export CSV format, are supported by the data logger for playback mode.
Display Options
![]()
Details: This is on by default. When unticked, the sidebars will be hidden, proving more chart space.
Smoothing: This is on by default and will remove some of the "stair casing" of the chart data.


Auto Range: This is off by default. This will adjust the chart range based on what has been logged so far (or the range during playback).


Legend: To hide the legend fly-box simply untick the legend icon.
Adjust Channels Units
Units must be adjusted whilst the PCM is disconnected. When doing this, the charts will be auto-scaled to the new unit type (for example from °F to °C).
Either adjust individually, from the Units dropdown:

Or adjust everything from bulk change:

Zooming
The time axis can be zoomed in and out using the scroll wheel on the mouse when hovered over the main chart. Either zoom to the Left or Right-hand side of the chart, up to a maximum of 1/8 second zoom level.
Using the keyboard, using the UP and DOWN arrow keys will also perform similar zoom functions.
Full shortcut keys are available with F1 or the Shortcuts icon.

If you have any questions about using the Datalogger, please feel free to raise a support ticket and we shall get back to you as soon as possible.
PCMTec Datalogger Overview.
PCMTec Datalogger 2.11 October 2022 Update.

